Analyzer - Documentation
Analyzer is a PureBasic Profiler originally written by Remi Meier. It can be used as an PureBasic IDE tool to measure how often lines of your PureBasic code are called and more importantly how much time they consume at runtime. It consists of two components, the analyzer tool and the analyzer runtime. The tool takes some arguments to merge a source file and its include files into a single file (using a third merge tool). The single file is then complemented with code for measurement as well as with some GUI code to display the results at the end of the runtime of your program.Installation
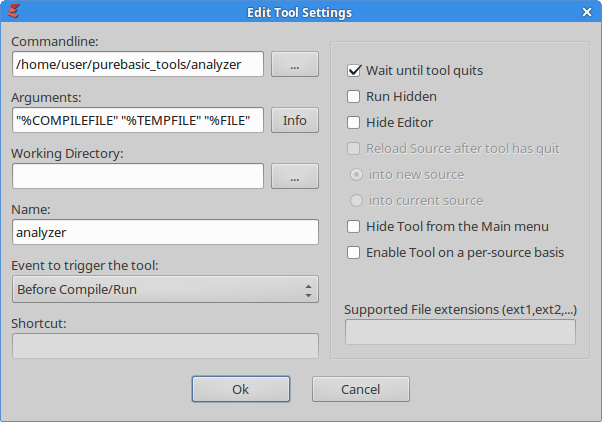
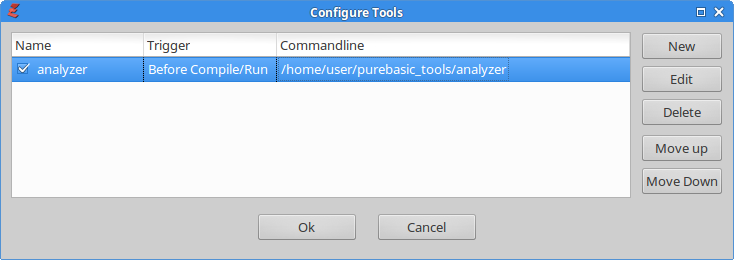
Copy the Linux binary analyzer or the Windows executable analyzer.exe to your PureBasic IDE tools directory, for example /home/user/purebasic_tools/. The program will create a preferences file analyzer.ini in its program directory. If you don't have a binary/executable you can create one from the source file analyzerTool.pb. The Threadsafe compiler option must be enabled and if you're on Windows you might have to remove the subsystem gtk2 in the compiler options in case it is set. With your tool binary in place, in the PureBasic IDE go to Tools > Configure Tools > New and set the binary/executable as well as the other settings as shown. The double quotes allow for filenames containing spaces to work correctly as well as identifying empty arguments passed by the IDE. Keep the order of arguments as the first two files might be modified by the tool.
---------------------------------------------------------------
Commandline               : /home/user/purebasic_tools/analyzer
Arguments                 : "%COMPILEFILE" "%TEMPFILE" "%FILE"
Name                      : analyzer
Event to trigger the tool : Before Compile/Run
also check                : [x] Wait until tool quits
---------------------------------------------------------------
Using the tool
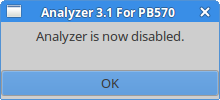
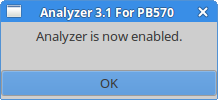
By running the tool from the tools menu you can disable/enable it. If disabled, it will not interfere with the compilation process.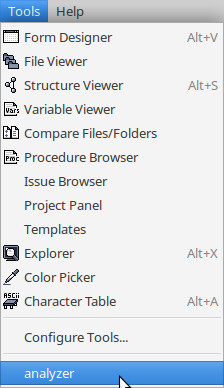
Make sure analyzer is enabled and open a new tab/file in the IDE and paste the following code.
x = 10
If 0 = Delay(x)
  Delay(2* x)
EndIf
If you press F5 to Compile/Run the code then analyzer will ask for confirmation.
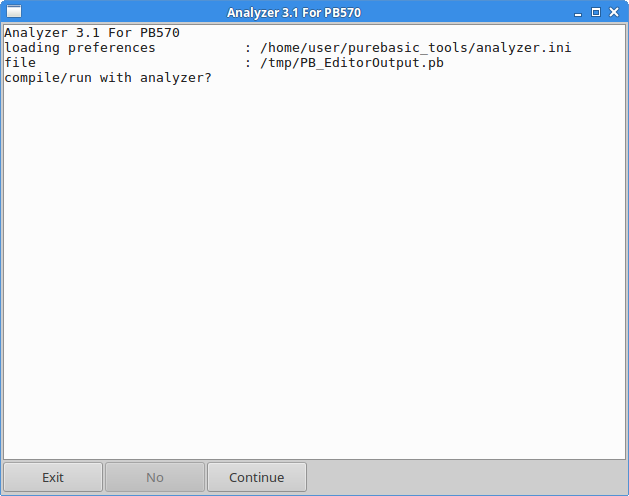
You can cancel with Exit (or with the ESC key or by closing the window) to compile/run your code without analyzer. After clicking Continue (or pressing the Return key) the merge tool will merge include files if there are any. It would also ask for confirmation to overwrite the *.merged.pb file in case it already exists. After the merge, analyzer will ask you for confirmation to overwrite the input file.
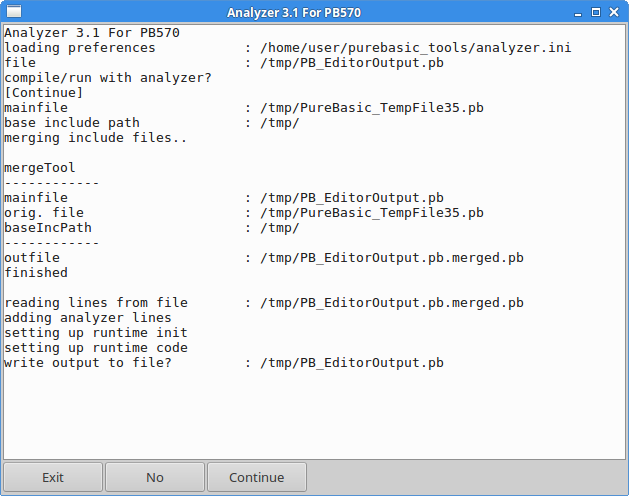
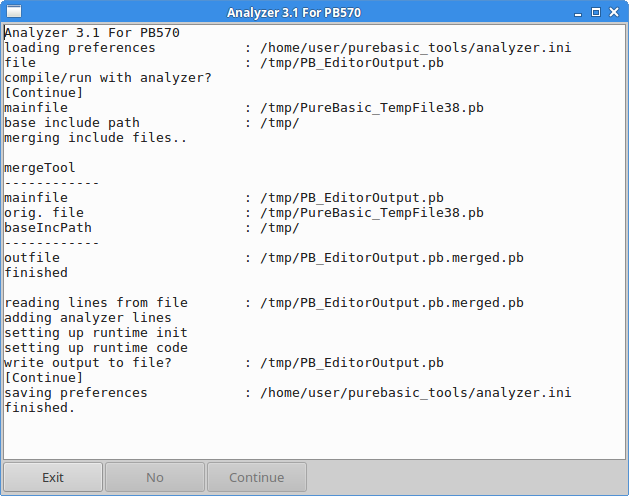
Choose Continue to modify the temporary file given by the IDE and close the tool with Exit/ESC when it has finished.
Using the runtime GUI
When the IDE runs your code the analyzer runtime will give you a notice if the debugger is enabled and you could stop the program, then disable the debugger for your source code and compile/run again.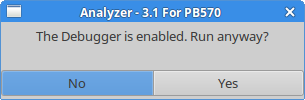
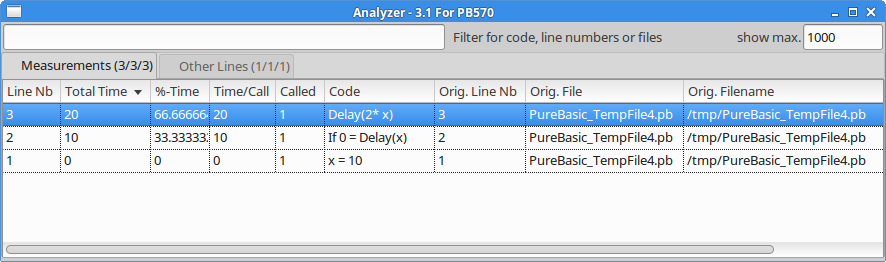
| Line Nb | The line number in the merged file. |
| Total Time | The sum of milliseconds spent by that line. |
| %-Time | The percentage of Total Time relative to all measurements. |
| Time/Call | The average time per call as calculated by Total Time / Calls. |
| Calls | The number of times the line has been called. |
|
Orig. Line Nb, Orig. File, Orig. Filename |
The original code location. In this case a temporary file because the file has not been saved before compilation. |
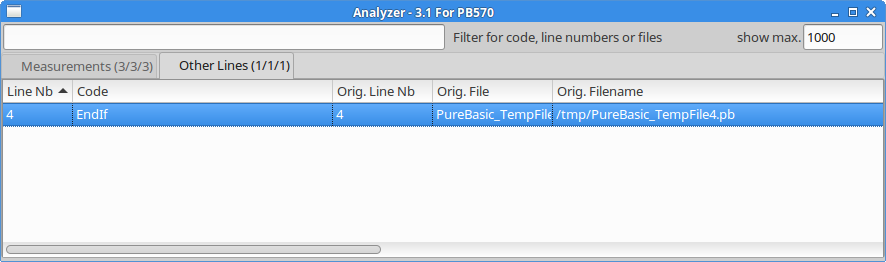
The second tab Other Lines contains lines that have been ignored, like EndIf or other keywords, or lines for which analyzer has been disabled.
You can double-click a list entry to open the location in the IDE. For this to work the tool program must have been run as a tool like in this case at least once to know the PureBasic IDE program path.
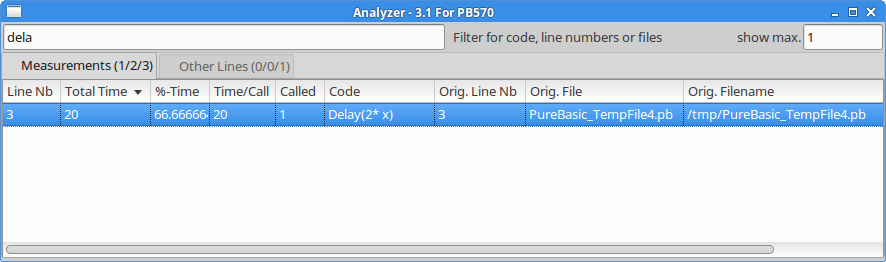
With the top left input field you can filter the shown results. The top right input field limits the number of shown list entries. The numbers in the panel tab headers show the number of shown / matching / total list entries. For example filtering for dela and setting show max. to only 1 will display (1/2/3) for the tab Measurements and only 1 of the 2 matching lines containing Delay() will be shown from the 3 total lines.
Control Comments
There are 4 control comments that can be used in the code and they start with ; analyzer: (exactly, including one space). They can be indented but there must not be any code before them on the line, otherwise the tool will throw a notice in the tool log window.With analyzer:disable and analyzer:enable you can deactivate the measurement for some lines:
Delay(5) ; measured (enabled by default)

; analyzer:disable
Delay(10) ; not measured
Delay(20) ; not measured
; analyzer:enable
Delay(30) ; measured
Delay(40) ; measured
You might want to start your mainfile with analyzer:disable and only enable it for specific code.
With analyzer:startblock and analyzer:endblock you can measure multiple lines of code as one block.
; analyzer:startblock
Delay(10)
Delay(20)
; analyzer:startblock block name
Delay(30)
Delay(40)
; analyzer:endblock
; analyzer:endblock
analyzer:startblock can have an optional text for displaying in the result list ('block name' in the example). The unnamed first block above will measure 100ms and the second block will measure 70ms. The last endblock finishes the measurement for the first startblock. The lines containing Delay() will still also be measured individually unless analyzer:disable is used, which in turn doesn't affect the block measurement.
What is [not] being measured
Analyzer will be disabled automatically for blocks ofEnableASM / DisableASM
Structure / EndStructure
Structureunion / EndStructureUnion
Enumeration / EndEnumeration
Interface / EndInterface
DataSection / EndDataSection
Macro / EndMacro
Import / EndImport
It will also not measure individually (but still as part of a block or call) lines of
- inline ! asm
- ProcedureReturn ..
- conditions/heads/tails of loops
- Select / Case / Default statements (code within the Case / Default section itself will be measured as usual)
- Debug statements
But it will measure conditions of If and ElseIf (I guess the same could work for While and Until conditions but that's not implemented currently).
It supports line concatenation - each part will be measured individually if applicable:
x + 1 : If x : x + 1 : EndIf
It supports split lines / line continuation. such lines will be measured and displayed as one.
Procedure p(p1,
            p2)
EndProcedure

If x And
   x +
   1 Or
   p(11,
     22)
EndIf
Macro definitions/bodies will not be measured, but macro invocations will be measured as usual. If your macros contain code like [End]Procedure or [End]Structure or otherwise affect the natural nesting of code then you will most likely get a compilation error with the code generated by analyzer.
The Merge Tool
The merge tool has been improved a bit but currently still only supports bare string literals for include statements, no string concatenation or evaluation of constants. CompilerIf / CompilerSelect statements are also not being evaluated. That might not be a problem if the merger just includes files for example within dead CompilerIf 0 branches because the included code will still be ignored by the PureBasic compiler. But in the following example the merger will resolve the first IncludeFile statement but not the second XIncludeFile statement (because the file has been included already), whereas the PureBasic compiler would handle it the other way round:CompilerIf 0 IncludeFile "file" CompilerEndIf XIncludeFile "file"
Another issue with this is that the merging of the following code will fail no matter which OS you're currently working with, because the merge tool will try to resolve both include statements and it will result in a file error for one of them:
CompilerIf #PB_Compiler_OS = #PB_OS_Windows
  XIncludeFile "C:\path\file"
CompilerElse
  XIncludeFile "/path/file"
CompilerEndIf
The merge tool will replace occurrences of #PB_Compiler_IsMainFile and #PB_Compiler_IsIncludeFile as follows depending on where they occur:
| #PB_Compiler_IsMainFile | (1 + 0 * #PB_Compiler_IsMainFile) | In the mainfile |
| #PB_Compiler_IsMainFile | (0 + 0 * #PB_Compiler_IsMainFile) | In an include file |
| #PB_Compiler_IsIncludeFile | (0 + 0 * #PB_Compiler_IsIncludeFile) | In the mainfile |
| #PB_Compiler_IsIncludeFile | (1 + 0 * #PB_Compiler_IsIncludeFile) | In an include file |
Performance / Accuracy
The analyzer code could impact the performance of you code quite a bit depending on how much of your code is being measured. When in doubt, measure only relevant parts of your code and/or use block measurement to decrease the per-line impact. You might also want to analyzer:disable before blocks to disable the individual measurement of lines within the block.As for accuracy. If you are testing something with Delay() keep in mind that a Delay(4) could also take 10 milliseconds. But in general, lines that take very little time are measured less accurate. That could be compensated for if the line gets called more often. The addition within the following loop will on its own never take a millisecond but it's called often enough so that ElapsedMilliseconds() returns a different value before and after the line during some iterations, which will add up finally.
x+1
x+1
x+1
For i=0 To 100000
  x+1
Next
Preferences
The analyzer tool binary/executable will maintain a preference file <program name>.ini (usually analyzer.ini) in its program directory. The settings will only be written back to the file if the tool exits normally after finishing successfully. The following settings exist:| analyzerActive | Bool, 1 (Default) or 0 | Defines if the tool will interfere with the compilation process when triggered as a tool. |
| inlineProc | Bool, 1 (Default) or 0 | Defines if the measurement code will be inlined for normal lines and blocks or if a function call is being used instead. If/ElseIf conditions can't be inlined and will always use function calls. |
| showZeroTimeLines | Bool, 1 (Default) or 0 | Defines if measurements with a total time of 0 will appear in the results list / GUI. |
| lastPbToolIde | Full path to the PureBasic IDE program that will be used to open pb source files. Will be updated with the path of the IDE that started the tool. Will be passed on to the runtime (which doesn't have access to the tooling environment) so it can let you open result lines in the IDE. Will also be used by analyzer if not started from the IDE, i.e. if started as a commandline program. | |
| lastPbToolCompiler | Full path to the PureBasic compiler program that will be used to resolve occurrences of #PB_Compiler_Home in include statements during the run of the merge tool. Will be updated with the path to the currently used compiler passed to the tool by the IDE. The merge tool will receive a trimmed version (without the directory and binary name compilers/pbcompiler, or Compilers/pbcompiler.exe on Windows) that matches the format of #PB_Compiler_Home. Will also be used by analyzer if not started from the IDE, i.e. if started as a commandline program. | |
| toolWindowWidth / toolWindowHeight | Integer, Pixels | Stores the tool window size. (The size of the runtime results window is not stored because currently it doesn't know the tool's preferences file since it basically runs as part of your own program) |
| writeAnalysisTxt | Bool, 1 or 0 (Default) | Defines if the results should be written to a file analysis.txt in the runtime execution directory (depending on your compiler options that would be the directory for temporary files used by the IDE or the directory of your source code). |
| stickyToolWindow | Bool, 1 (Default) or 0 | Defines if the tool window should be sticky / stay on top. |
| stickyRuntimeWindow | Bool, 1 (Default) or 0 | Defines if the runtime results window should be sticky / stay on top. |
Example preferences file /home/user/purebasic_tools/analyzer.ini:
analyzerActive = 1
inlineProc = 1
showZeroTimeLines = 1
lastPbToolIde = /home/user/purebasic_570_lts/compilers/purebasic
lastPbToolCompiler = /home/user/purebasic_570_lts/compilers/pbcompiler
toolWindowWidth = 627
toolWindowHeight = 470
writeAnalysisTxt = 0
stickyToolWindow = 1
stickyRuntimeWindow = 1
The default values of lastPbToolIde and lastPbToolCompiler will be empty, so if you want to open code lines from within the results window or if you are using the constant #PB_Compiler_Home in include statements then you have to start analyzer as a tool from the IDE at least once (It is sufficient to start it from menu without any arguments) or you have to create/edit the file analyzer.ini manually before using analyzer as a command-line program if you need to access these settings.
If you start analyzer as a command-line program (or by drag'n'dropping a source file onto it) then make sure that analyzer is enabled (via the PureBasic IDE tools menu entry or by editing the preferences file and setting analyzerActive to 1). Otherwise the program will silently ignore the task.
Some Other Infos
Control comments take effect in compilation order, i.e from top to bottom in the source code, not in runtime order.; analyzer:disable ; disabled Procedure pE() ; analyzer:enable ; enabled Delay(10) ; measured EndProcedure Delay(20) ; measured Procedure pD() ; analyzer:disable ; disabled Delay(30) ; not measured EndProcedure Delay(40) ; not measured pE() ; not measured pD() ; not measured Delay(50) ; not measured ; analyzer:enable ; enabled Delay(60) ; measured pE() ; measured pD() ; measured Delay(70) ; measured
Analyzer shows percentages as relative to the total of measurements, even if some measurements are overlapping. To show percentages as relative to the actual time the program has spent would require analysis of call hierarchy or the additional overhead of watching caller/parent measurements.
Procedure p()              ; shown as     actual ;
  Delay(100)               ;   25%          50%  ;
  Delay(100)               ;   25%          50%  ;
EndProcedure
p()                        ;   50%         100%  ;
analyzer:enable / analyzer:disable don't maintain a stack so you shouldn't nest them. An analyzer:disable will disable the analyzer even if there were multiple analyzer:enables beforehand and vice versa. Blocks on the other hand can be nested.
Threading is not supported by analyzer. If measured code is called by multiple threads the analyzer data and processes are likely to get screwed up. Adding mutexes would come with a performance overhead and also would probably change the execution conditions. And even then a time measured in one thread might include time spent by another thread or spent waiting, so it seems to make little sense to support it.
That's it for now.
Thanks to Remi Meier and the Forums / the Community!